
Science
Scientific investigations produce data that must be analyzed in order to derive meaning. Because data usually do not speak for themselves, scientists use a range of tools—including tabulation, graphical interpretation, visualization, and statistical analysis—to identify the significant features and patterns in the data. Sources of error are identified and the degree of certainty calculated. Modern technology makes the collection of large data sets much easier, thus providing many secondary sources for analysis.
Engineering
Engineers analyze data collected in the tests of their designs and investigations; this allows them to compare different solutions and determine how well each one meets specific design criteria—that is, which design best solves the problem within the given constraints. Like scientists, engineers require a range of tools to identify the major patterns and interpret the results. (Framework, p. 51)
See A Framework for K-12 Science Education, 2012, p. 61 for the entire text for Practice 4: Analyzing and interpreting data.
In the video below from BozemanScience.com, Paul Andersen explains how scientists analyze and interpret data. He discusses how data can be organized in a table and displayed using a graph. Through this practice, students learn how to present and evaluate data.
Analyzing & Interpreting Data Progression through Gradebands:
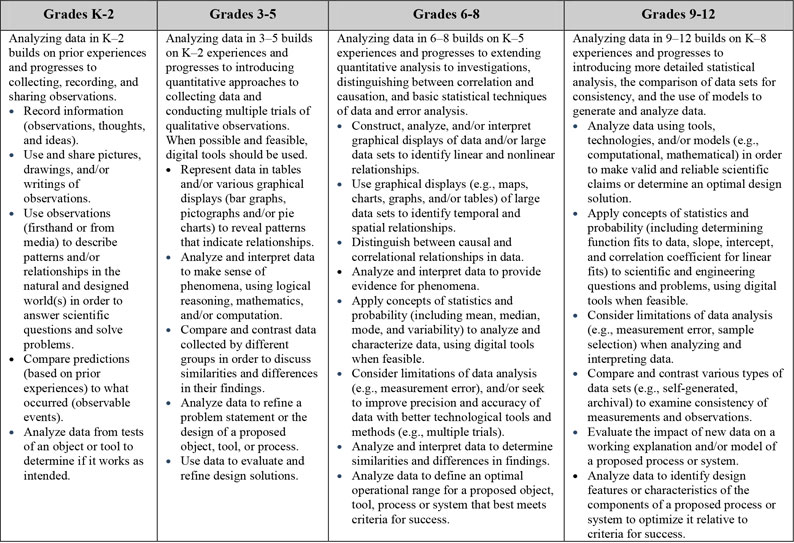
Progression from NGSS Appendix F p. 9.
Activities
Three Conceptual Change Activities are included to help teachers and students Confront Beliefs:
- Analyzing & Interpreting Data Activity #1: Pendulums
- Analyzing & Interpreting Data Activity #2: Old Faithful Eruption
- Analyzing & Interpreting Data Activity #3: Most Average Person
Also refer to Student Work in the Practice for real-life examples of how MPRES teachers have applied this Practice.
The purpose of the activities is to engage teachers in the Practice of Analyzing and Interpreting Data, so importance is placed on generating a lot of data and having learners analyze and interpret the data. The emphasis is NOT on the activity itself, but rather conceptual change related to the Practice. Consumers of this Toolkit are reminded not to get wrapped up in the activity, but rather continually reflect on the conceptual nature of the Practice to gain deeper understanding.
Since these activities are NOT lesson plans, in some cases only a brief explanation of the activity has been provided. Professional development facilitators should encourage learners to direct their own investigations and intervene only as needed to redirect.
To facilitate conceptual change throughout each activity, you should consider the following questions. These questions are also repeated at key points in each activity to assist you.
Awareness Questions:
- From the background information, what new awareness do you have about analyzing and interpreting data?
- How does this practice support analyzing and interpreting data?
- In a 3-Dimensional Classroom, who do you think needs to be analyzing and interpreting data?
- What questions did the background raise for you?
Expose Belief Questions:
- What are your current beliefs about the analyzing and interpreting data practice?
- What beliefs do you have from prior knowledge, education or professional development regarding this practice?
- How well do you feel you meet the expectations of this practice as a teacher?
Debrief activities by focusing on the conceptual understanding of the practice using the following prompts.
Resolve Belief Questions:
- In what ways did this activity change your beliefs about analyzing and interpreting data?
- How difficult do you find it to analyze and interpret data?
- What skills related to analyzing and interpreting data do you need in order to successfully complete these activities with your students?
- How can technologies such as graphing calculators, tablet and phone apps, and spreadsheet software support this practice?
Extend the Concept Questions:
- How do you currently help students collect, interpret, and graph data in your classroom
- Review and evaluate a recent lesson you taught. How effective is it for engaging students in analyzing and interpreting data?
- What is the relationship between this practice and other practices?
Go Beyond Questions:
- Challenge yourself to learn how to use different types of graphs (such as bar graphs or histograms, pie charts, line graphs, scatterplots, etc.) appropriate for the level you teach.
- Use different technology (probeware) and/or programs to build tables and graphs.
- Use the EQuiP Rubric for Lessons & Units: Science (PDF format) to evaluate a recent science lesson you taught.
- Ask a colleague to observe one of your lessons OR video yourself teaching and reflect specifically on defining problems and identifying constraints.