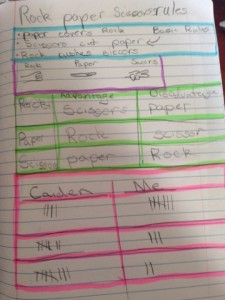
- Fifth grade students analyze and interpret “Rock, Paper, Scissors” scores to determine fairness of advantages and disadvantages (connects to invasive species).
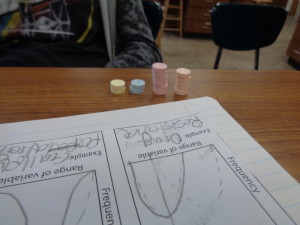
- High school students model gene flow and genetic drift with smarties candies. Students modeled the phenomena, then graphed them to see how the alleles changed in the populations.
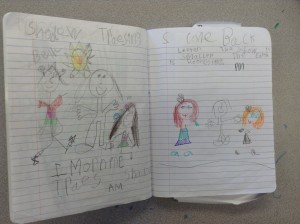
- First grade students trace their shadows in order to understand that the earth is rotating even though it appears the sun is moving across the sky. Shadow tracing enabled them to analyze and interpret their data and draw conclusions.
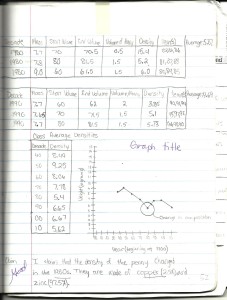
- Middle school students collect data to determine the decade (year if possible) that the composition of the penny changed. They had a variety of sources and pennies from several decades.


