
The following activity has been used with undergraduate students. The purpose of its inclusion here is to show a model of how to engage and guide learners in the Planning & Carrying Out Investigations Practice.
Assignment: Data Collection Method Report
Your Data Collection Method Report will consist of the following sections:
- Introduction/Overview of Study
- Methods (choose your own order of presentation of the following)
- Subject name
- Scientific and common name
- Description of subject: physical & life history traits
- What have you already learned about them after conducting 1 hour observation (doing ethogram)
- Describe Sampling Rule(s)* to be used; indicate if already used
- Describe Recording Rule(s)* to be used; indicate if already used
- State hypothesis(es) being explored and any prediction(s) that arise from hypothesis(es)
- Timeline/plan for data collection; can include time already spent if study in progress
- Example of data collection sheet
- Data summary plan
- Data analysis plan
- Subject name
- Summary
- Thoughts, ideas, comments about the methods you are planning to use and your confidence in those methods
- Any other comments (optional); can include your reflections on this process and lessons learned, issues or concerns, etc.
* Should be one of the methods described in Chapter 5, Recording Methods in Measuring Behavior by Martin and Bateson.
Format of Report – Please follow the guidelines already explained for the previous two reports, with the following exceptions:
Pages: Minimum of 1 full page of text; maximum of 3 pages. Any tables, pictures or other type of graphics are not included in page limits.
Sources: Please follow guidelines already provided for in-text citations and reference list.
Brief Overview of Nonparametric Methods
(Taken directly from Statsoft.com, now part of Dell Software)
Basically, there is at least one nonparametric equivalent for each parametric general type of test. In general, these tests fall into the following categories:
- Tests of differences between groups (independent samples);
- Tests of differences between variables (dependent samples);
- Tests of relationships between variables.
Differences between independent groups. Usually, when we have two samples that we want to compare concerning their mean value for some variable of interest, we would use the t-test for independent samples. Nonparametric alternatives for this test are the Wald-Wolfowitz runs test, the Mann-Whitney U test, and the Kolmogorov-Smirnov two-sample test. If we have multiple groups, we would use analysis of variance (see ANOVA/MANOVA) the nonparametric equivalents to this method are the Kruskal-Wallis analysis of ranks and the Median test.
Differences between dependent groups. If we want to compare two variables measured in the same sample we would customarily use the t-test for dependent samples (for example, when comparing students’ math skills at the beginning of the semester with their skills at the end of the semester). Nonparametric alternatives to this test are the Sign test and Wilcoxon’s matched pairs test. If the variables of interest are dichotomous in nature (i.e., “pass” vs. “no pass”) then McNemar’s Chi-square test is appropriate. If there are more than two variables that were measured in the same sample, then we would customarily use repeated measures ANOVA. Nonparametric alternatives to this method are Friedman’s two-way analysis of variance and Cochran Q test (if the variable was measured in terms of categories, e.g., “passed” vs. “failed”). Cochran Q is particularly useful for measuring changes in frequencies (proportions) across time.
Relationships between variables. To express a relationship between two variables one usually computes the correlation coefficient. Nonparametric equivalents to the standard correlation coefficient are Spearman R, Kendall Tau, and coefficient Gamma (see Nonparametric correlations). If the two variables of interest are categorical in nature (e.g., “passed” vs. “failed” by “male” vs. “female”), appropriate nonparametric statistics for testing the relationship between the two variables are the Chi-square test, the Phi coefficient, and the Fisher exact test. In addition, a simultaneous test for relationships between multiple cases is available: Kendall coefficient of concordance. This test is often used for expressing inter-rater agreement among independent judges who are rating (ranking) the same stimuli.
Descriptive statistics. When one’s data are not normally distributed, and the measurements at best contain rank order information, then computing the standard descriptive statistics (e.g., mean, standard deviation, etc.) is sometimes not the most informative way to summarize the data. For example, in the area of psychometrics it is well known that the rated intensity of a stimulus (e.g., perceived brightness of a light) is often a logarithmic function of the actual intensity of the stimulus (brightness as measured in objective units of Lux). In this example, the simple mean rating (sum of ratings divided by the number of stimuli) is not an adequate summary of the average actual intensity of the stimuli. (In this example, one would probably rather compute the geometric mean.) Nonparametrics and Distributions will compute a wide variety of measures of location (mean, median, mode, etc.) and dispersion (variance, average deviation, quartile range, etc.) to provide the “complete picture” of one’s data.
Figures, Tables & Reference Format
(almost exactly as described in Journal of Animal Behaviour, Author Instructions)
Figure captions
Ensure that each illustration has a caption; caption should be at the top of the figure. A caption should comprise a brief title (not on the figure itself) and a description of the illustration. Keep text in the illustrations themselves to a minimum, but explain all symbols and abbreviations used.
Tables
Number tables consecutively, with Arabic numerals, in accordance with their appearance in the text. Each table should have a caption with a description of what the table describes. Place footnotes to tables below the table body and indicate them with superscript symbols. Be sparing in the use of tables and ensure that the data presented in tables do not duplicate results described elsewhere in the article.
References
Check that all references in the text are in the reference list and vice versa, that their dates and spellings match, and that complete bibliographical details are given, including page numbers, names of editors, name of publisher and full place of publication if the article is published in a book. For papers in the course of publication, use ‘in press’ to replace the date and give the journal name in the references. Cite unpublished manuscripts (including those in preparation or submitted), talks and abstracts of talks in the text as ‘unpublished data’ following a list of all authors’ initials and surnames. Do not include these in the reference list.
Web references
The full URL should be given. Any further information, if known (DOI, author names, dates, reference to a source publication, etc.), should also be given.
Reference management software
The Journal of Animal Behaviour has standard templates available in key reference management package EndNote. Using plug-ins to word processing packages, authors only need to select the appropriate journal template when preparing their article and the list of references and citations to these will be formatted according to the journal style which is described below.
Reference style
Text:
All citations in the text should refer to:
- Single author: the author’s name (without initials, unless there is ambiguity) and the year of publication;
- Two authors: both authors’ names and the year of publication;
- Three or more authors: first author’s name followed by “et al.” and the year of publication. Note that “et al.” is not in italics.
Do not use commas to separate the author’s name from the date. Use lower-case letters to distinguish between two papers by the same authors in the same year (e.g., Packer 1979a). List multiple citations in chronological order (e.g. Zahavi 1972; Halliday 1978; Arnold 1981a, b), using a semicolon to separate each reference.
Reference List:
References should be arranged first alphabetically and then further sorted chronologically, if necessary. More than one reference from the same author(s) in the same year must be identified by the letters “a”, “b”, “c”, etc., placed after the year of publication. To help readers locate ‘et al.’ citations with the same first authors in the reference list, list references with three (or more) names after those with two, by date, as in the following sequence: Marin & Silva 1992; Marin, Silva & Lopez 1986; Marin, Lopez & Silva 1989
Use the following system for arranging your references:
- a. For periodicals
Robinson, M. H. & Robinson, B. 1970. The stabilimentum of the orb web spider, Argiope argentata: an improbable defense against predators. Canadian Entomologist, 102, 641-645. - b. For books
Bailey, N. J. 1981. Statistical Methods in Biology. 2nd edn. London: Unibooks. - c. For multi-author books
Emlen, S. T. 1978. The evolution of cooperative behaviour in birds. In: Behavioural Ecology (Ed. by J. R. Krebs & N. B. Davies), pp. 245-281. Oxford: Blackwell Scientific. - d. For theses
Smith, J. K. 1985. Investigations on a freshwater crab. Ph.D. thesis, University of Durham. - e. Forum articles should include volume and part number and Web site address and be cited as:
Johnson, A. R. 1999. Scent marking in hyaenas: reply to Jones. Animal Behaviour, 57, F41-F43.
Note that journal titles in the reference list should be written in full.
Work accepted for publication but not yet published should be referred to as “in press”. References concerning unpublished data and “personal communications” should not be cited in the reference list but may be mentioned in the text.
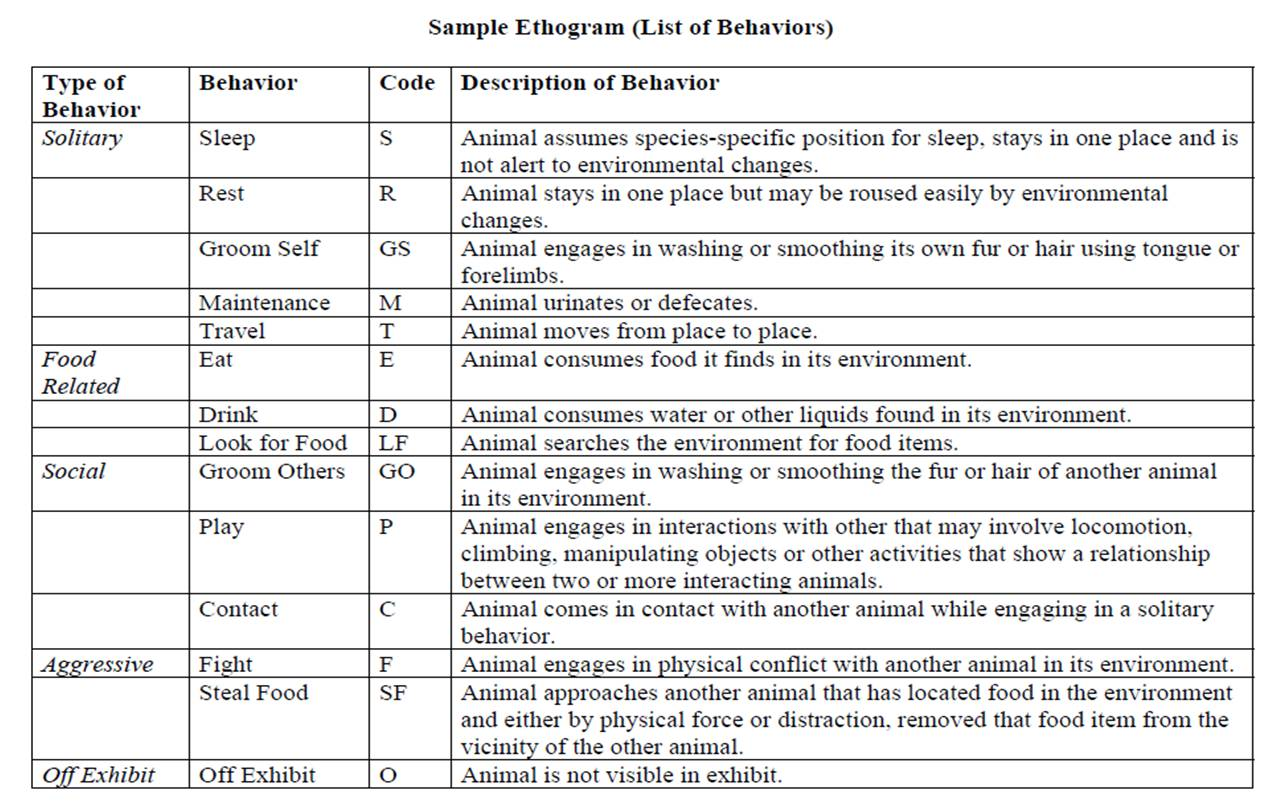
An example ethogram